JMP JSL Statistical Automation
SAS designed JMP to perform dynamic visual data exploration and statistical discovery. Rothenberg Industries, LLC fully automates any JMP process, custom report generation, and SPC pipeline using JSL (JMP Scripting Language).
Capabilities Matrix
What We Can Automate in JMP
From raw SQL queries to multi-variable ANOVA regressions, we build custom JSL scripts that eliminate repetitive manual data wrangling and produce publication-ready PDF reports.
- Six Sigma Control Charts: IR, X-bar, & R charts with SPC flagging, capability analysis (Cp / Cpk) using custom or Shewhart spec limits.
- Automated Data Ingestion: Direct ODBC import from SQL Server, Azure SQL, AWS, Access, Excel, CSV, & flat text files.
- Dataset Manipulation: Automated merging, sorting, filtering, and custom formula applications across complex datasets.
- Custom Report GUIs & High-DPI PDFs: Interactive graphical user interfaces that compile statistical tests, hide unnecessary UI chrome, and output high-DPI vector PDFs.
- DOE & Measurement MSA: Design of Experiments (DOE) consultation, Gage R&R measurement systems analysis, ANOVA, and multi-variable regression.
Turnkey Automation Service
RAPID DELIVERYWe offer comprehensive services ranging from initial consulting conference calls to door-to-door turnkey solutions. Most custom applications can be developed to optimize your business efficiency in under two weeks.
Industrial Execution
JMP JSL Automation Case Studies
Real-world deployment examples of automated SPC analysis, custom GUI reporting, and database integration.
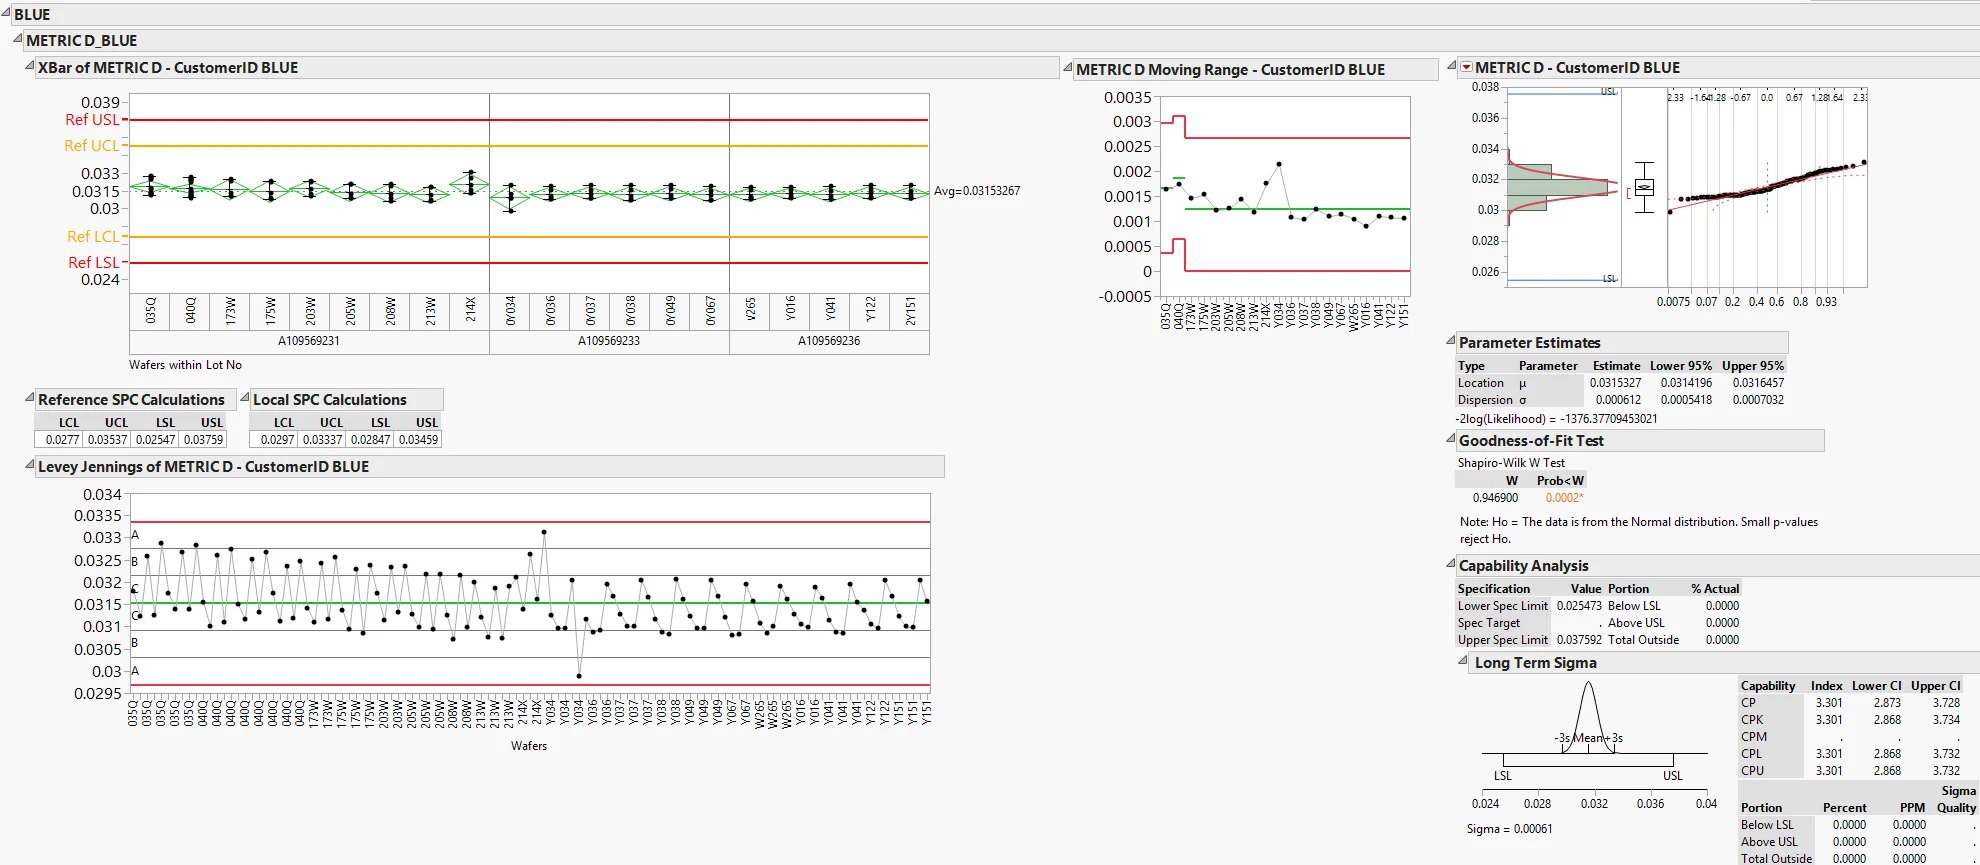
JMP Automated SPC Report with Capability Analysis
A two-step statistical analysis process that generates control & spec limits from a user-defined dataset and then generates an SPC report from another dataset using reference limits generated by the first step.
The first script prompts the user for a lot range and calculates control and spec limits defined by ±3σ and 5σ respectively. The "CL/SL Generator" script delimits data by variable levels, family, or lot, saving these limits into a master table. The second "SPC Analysis" script imports reference CL/SL sets and compiles an X-bar Variability Chart, Moving Range Chart, and Levey Jennings SPC chart with WECO rule violation flagging.


JMP Report Generator with GUI and High-DPI PDF Output
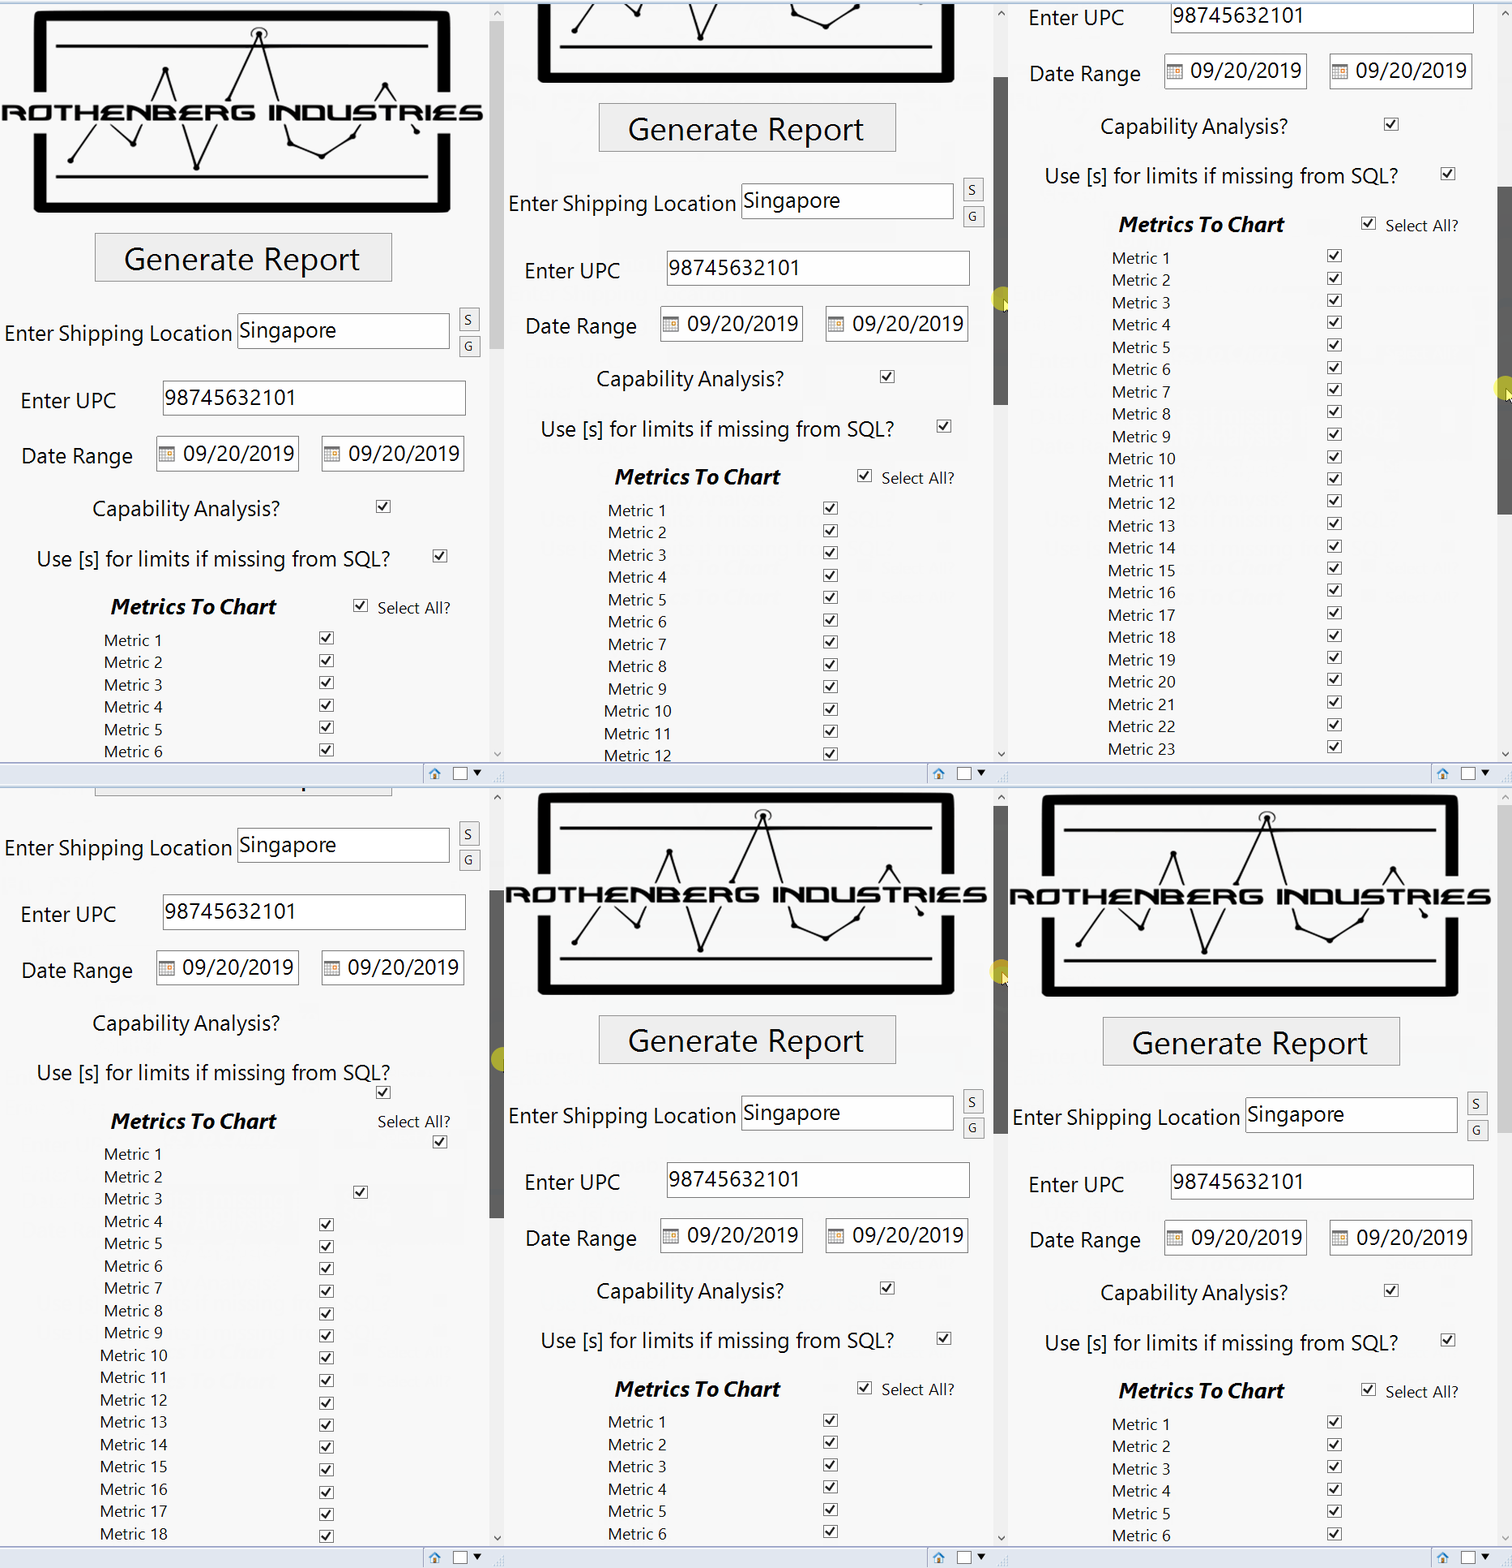
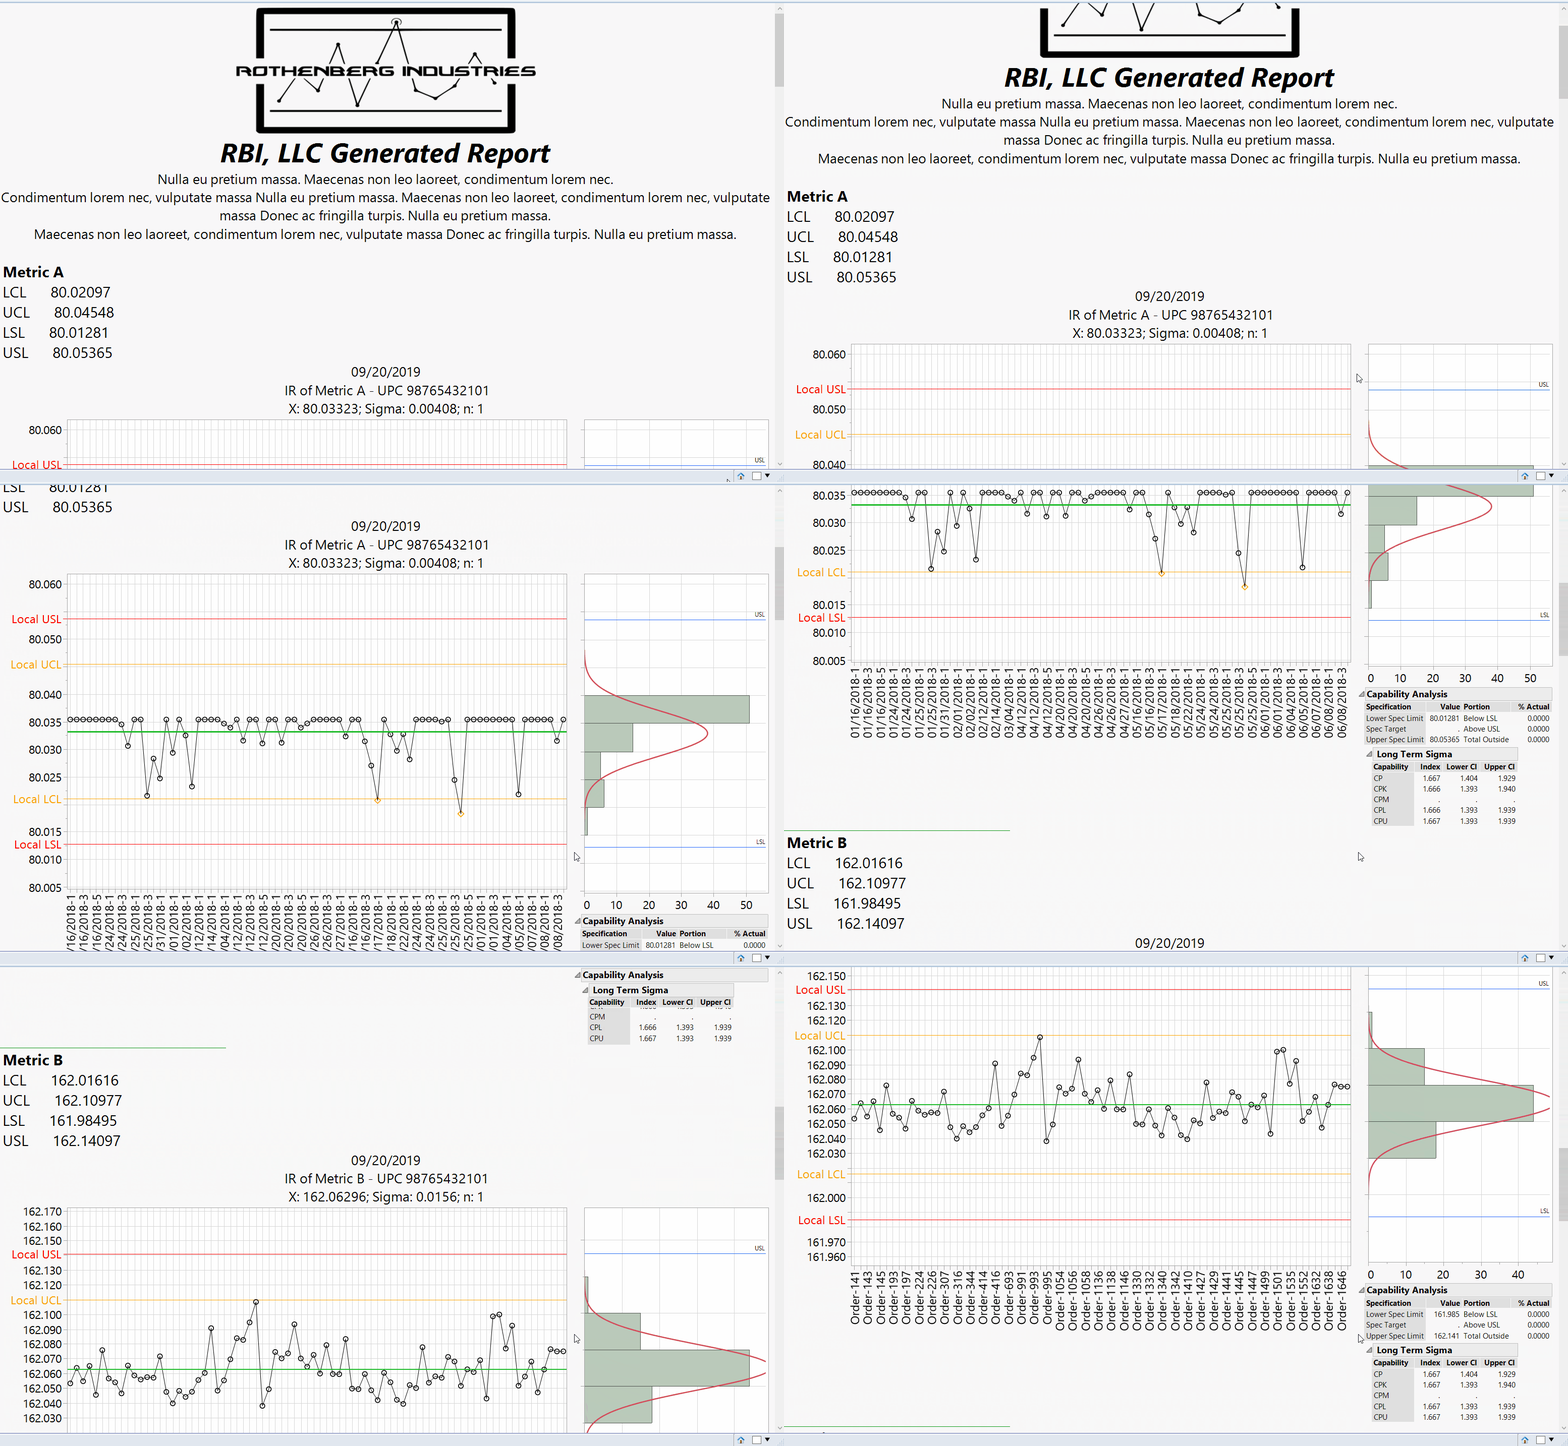
Designed for an enterprise client to provide operators with a simple Graphical User Interface (GUI) to specify reporting parameters, import metrics from Microsoft SQL Server tables via ODBC, compile distribution and run charts, and export a formatted PDF report window automatically.
Upon running the script, the GUI displays interactive options allowing operators to toggle capability analysis (Cp / Cpk) and switch between calculated ±3σ / 5σ limits or live SQL master tables.
Technical Foundations
Essential Statistical Review
Fundamental analytical statistical concepts for interpreting empirical process data and drawing valid inferences.
The Population and Sample
Inferential statistics makes generalizations from your sample data to a larger population based on probability theory. Descriptive statistics organize and summarize the main characteristics of your sample data.
Inferential Statistical Process
- Identify the target population or industrial application.
- Draw a statistically representative sample.
- Compute sample statistics to describe sample characteristics.
- Use sample information to make valid inferences about the population.

Central Limit Theorem
The Central Limit Theorem states that the distribution of the sum of random variables approaches a normal distribution as sample size increases, regardless of the underlying population distribution. A sample size of N = 25–30 is the standard industry threshold for population inference.
Confidence Intervals
A confidence interval provides a range of values associated with a specified confidence level (e.g. 95%) that contains the true population parameter. If sample mean x̄ = 10 kg and s = 1 kg, a 95% confidence interval is 10 kg ± 2σ.

Hypothesis Testing & Types of Error
Statistical testing evaluates two competing hypotheses: the Null Hypothesis (H0) of no effect/correlation, and the Alternative Hypothesis (H1) of a true relationship.
Significance Level (α)
Type I error rate (α): Probability of rejecting the null hypothesis when it is true (false alarm).
Statistical Power (1 − β)
Type II error rate (β): Probability of failing to reject H0 when false. Power (1 − β) is the probability of correctly detecting a true effect.

Get Started
Automate Your JMP Statistical Workflows
Whether you need a quick consulting call or a complete door-to-door JSL script package, we deliver production-ready JMP statistical automation.
Request JMP Automation Quote