Precision Data Acquisition
DAQ & LabVIEW Services
At Rothenberg Industries, we design turnkey data acquisition and automation solutions utilizing National Instruments hardware and custom LabVIEW development.
The Full Data Cycle: Step 1
Capturing Physical Reality
Data Acquisition (DAQ) is the vital first step in your automation journey. It is the automated collection of data from sensors and instruments on the factory floor or in the laboratory.
By interpreting Thermocouple, Current, or Voltage signals from any transducer, we bridge the gap between physical hardware and your digital database. We design turnkey solutions that don't just "read" data—they allow you to store, display, and analyze it in real-time.
Hardware Control
- NI, MCCDAQ, & Omega
- Sensor Specification
- PID & Gain Scheduling
Software Logic
- Custom Front Panel HMI
- SQL & Azure Logging
- Auto-Tuning Algorithms

Industrial Case Study
Ethernet-Enabled Manufacturing DAQ System
Project Scope: Implementation of a high-traceability system for dozens of manufacturing furnaces and hydraulic presses. The objective was to provide data acquisition with component-level serial number tracking across a multi-user shop floor environment.
The Solution: We developed a LabVIEW data acquisition system running on a protected networked terminal server. This central hub controls multiple ethernet-enabled DAQ devices, allowing qualified engineers to interface with a central panel from any location while operators manage production via shop-floor terminals.
The system is configured via Microsoft Excel and includes real-time alarms for over-temp and uniformity. Upon run completion, a VBA script analyzes the raw data, calculates cycle metrics, and pushes them to a SQL database for JMP JSL statistical analysis.
System Architecture

Data Flow: Real-time writing to *.flat files ensures data integrity during network interruptions, with post-run SQL migration for SPC analysis.
Academic Research Case Study
Tank Level PID Controller Simulation
Developed for a the EECE Dept. at Washington University, this project required a proof-of-concept simulation for controlling liquid level height in a pressurized research quench vessel. The solution utilized the LabVIEW Control Design and Simulation Module to model fluid entry at a constant rate (Q1) against a PID-controlled outlet valve (Q2) via a PID algorithm with Relay auto-tuning and gain scheduling based on tank pressure ranges.
Key Objective
Establish starting PID Gain values for implementation in a pressurized vessel environment.
Optimization
Utilized LabVIEW Control Design & Simulation Module with PID Relay auto-tuning (Ziegler-Nichols method).
Technical Assumptions
- Uniform liquid density throughout.
- Straight, vertical tank walls.
- Constant Control Volume (CV).
- Pump pressure constant throughout run.
- No pump time delay (Steady Flow).

Figure 1: Constant volumetric flow in, PID controlled flow out.
Foundational Mathematical Model
01. Valve Flow Dynamics
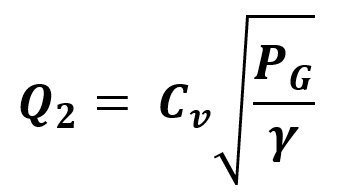
Flow through a valve is proportional to the square root of the pressure drop:
02. Linear Momentum
Conservation of linear momentum for the control volume:

03. Derived Model
Assuming constant momentum and density ($\rho \approx c, \gamma \approx 1$):

Integrating Bernoulli's principle for incompressible flows:

Open Loop Simulation Logic

This nonlinear differential equation for $h(t)$ is integrated numerically by the simulator. Figure 2 (left) shows the block diagram where the control valve is 100% open, establishing the baseline dynamics of the vessel.
Closed Loop PID Controller
The controller receives liquid level height in real-time and manages the variable output valve. A lookup table determines the nonlinear Cv value from OEM specifications.

Autotuning Results
Initial Gains: $Kc = 10, Ti = 0.1$. After Setpoint Relay experiment:
Gain Scheduling Logic

Figure 9: Closed loop simulation with autotuning and gain scheduling as a function of pump pressure.

Final Implementation
Front Panel HMI Design
The final front panel provides real-time visualization of the liquid level, PID status, and alarm states. As observed in Figure 13 (left), the output valve fully opens to meet setpoints, then closes just enough to maintain constant setpoint height with zero-overshoot stability.